
Consumer review analysis
Why do they buy, and what frustrates them?
- Unified analysis of text, audio, and video reviews
- Purchase drivers, satisfaction, and dissatisfaction
- Beauty, appliances, automotive, and more
AI Consumer Insight Platform
We analyze the real voice of your customers across text, audio, and video reviews,
and turn it into actionable strategy for product planning and marketing.
DILLAB Insight Dashboard
Sample dataReviews analyzed
12,480
Positive share
68%
Top complaint
Price
Overall score
6.5 / 10
▲ 0.4
Positive vs. negative reviews by month
AI insight summary
Channels
From retail reviews to social and video content
About DILLAB
DILLAB analyzes customer reviews with AI, then adds the judgment of seasoned consumer researchers, so you get strategy you can put to work right away.
We dig deep to surface the insights that matter.
We connect diverse data to find what is truly meaningful.
We create new value that brings more delight to businesses and consumers.
Expert Service
Plenty of data, but no time or team to analyze it?
DILLAB AI runs the first pass. Our experts then analyze and validate the findings and deliver a report with strategic recommendations.
01
We design the channels and metrics with you, based on your product category and target audience.
02
Not just numbers: marketing strategies and action plans you can apply right away.
03
Track market shifts and customer reactions on a real-time dashboard.
DILLAB
Reviews explain the why. Commerce data shows the results.
Why do they buy, and what frustrates them?
Who sold, how, and how much?
Consumer review analysis
Multimodal Engine
Not just summaries: strategy you can act on
Text, audio, and video unified in a single analysis framework
01 · Input
Text
Review text and ratings
Audio
Short-form and YouTube audio
Video
Product use and demo videos
02 · Engine
DILLAB Multimodal Intelligence Engine
Text · Audio · Video
03 · Analysis
Purchase drivers, satisfaction, and complaints, auto-classified
Side-by-side comparison with competing brands
04 · Insight
DILLAB Strategic Insight
Strategy reports built on 20+ years of research expertise
Multimodal Analysis
“It took me ages to get from unboxing to first use. I kept checking the manual.”
AI analysis
00:42“The bean container doesn't come off, so cleaning it is a bit of a hassle.”
AI analysis
AI analysis
Influencer commerce analysis
Different goals call for different types of creators.
DILLAB Creator Agent
Discover
Cast a wide net using cues inside videos
Classify
Group creators by format and category
Act
Prioritize collaborations by goal
Catch creators who mention your brand, even without tags
Match on lighting, tone, composition, and mood, beyond the profile
Narrow candidates by country, age, followers, and engagement
DILLAB Creator Agent sets priorities based on your goals and budget
Solutions
Beauty
Questions it answers
Built for
A Toner Pad · 1,842 reviews
Sample data6.5
/ 10 overall score
Competitor avg. 6.1
Competitor avg.
“It's gentle, but the price is a bit steep.”
Appliances
Questions it answers
Built for
Fully automatic coffee machines · Purchase drivers, 5 brands (%)
Sample data| Brand | Design | Convenience | Size | Price | Taste |
|---|---|---|---|---|---|
| Brand A | 52 | 21 | 8 | 12 | 31 |
| Brand B | 18 | 46 | 12 | 15 | 29 |
| Brand C | 22 | 51 | 9 | 18 | 24 |
| Brand D | 16 | 24 | 10 | 41 | 28 |
| Brand E | 11 | 17 | 49 | 20 | 26 |
Design drives Brand A, convenience drives Brand C, and size drives Brand E
Video analysis
Questions it answers
Built for
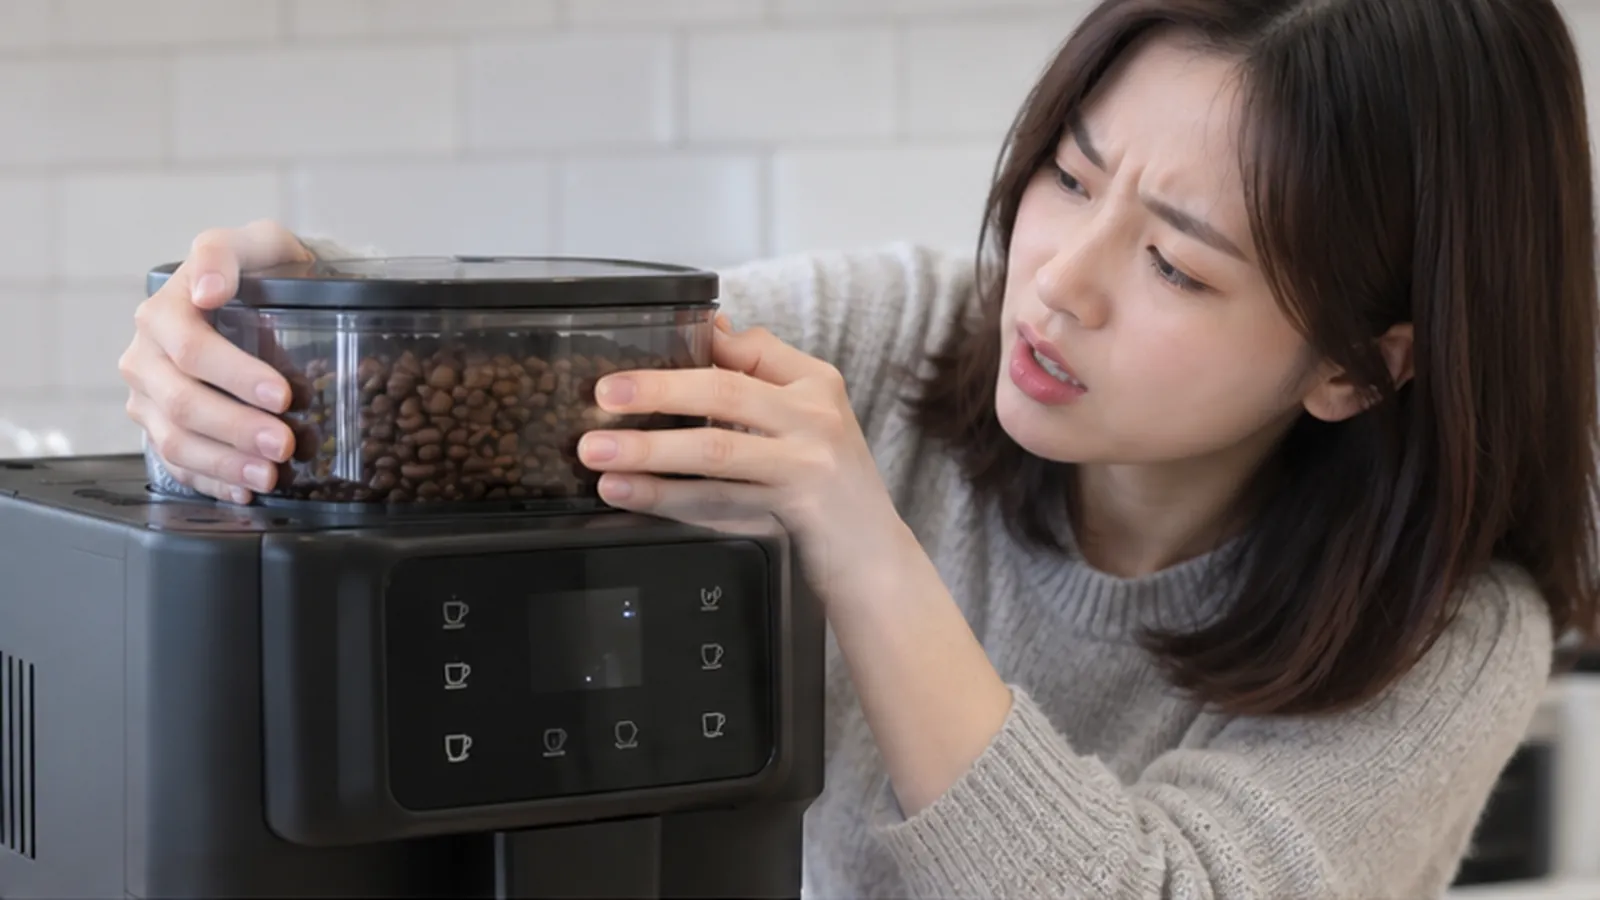
Usage video analysis · Coffee machine
Sample data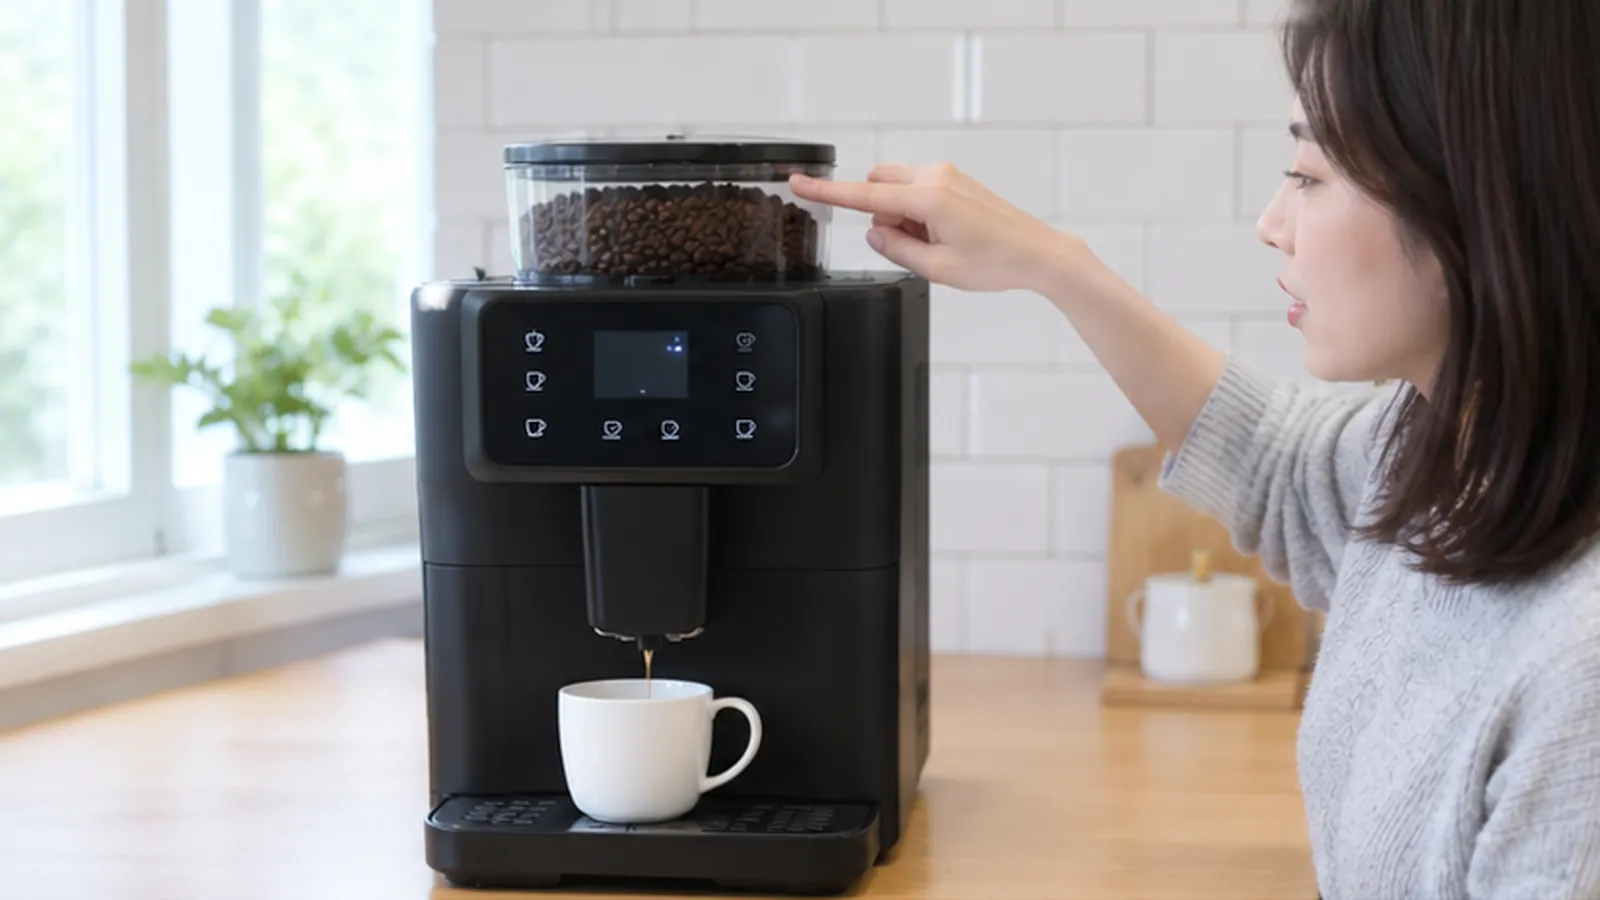
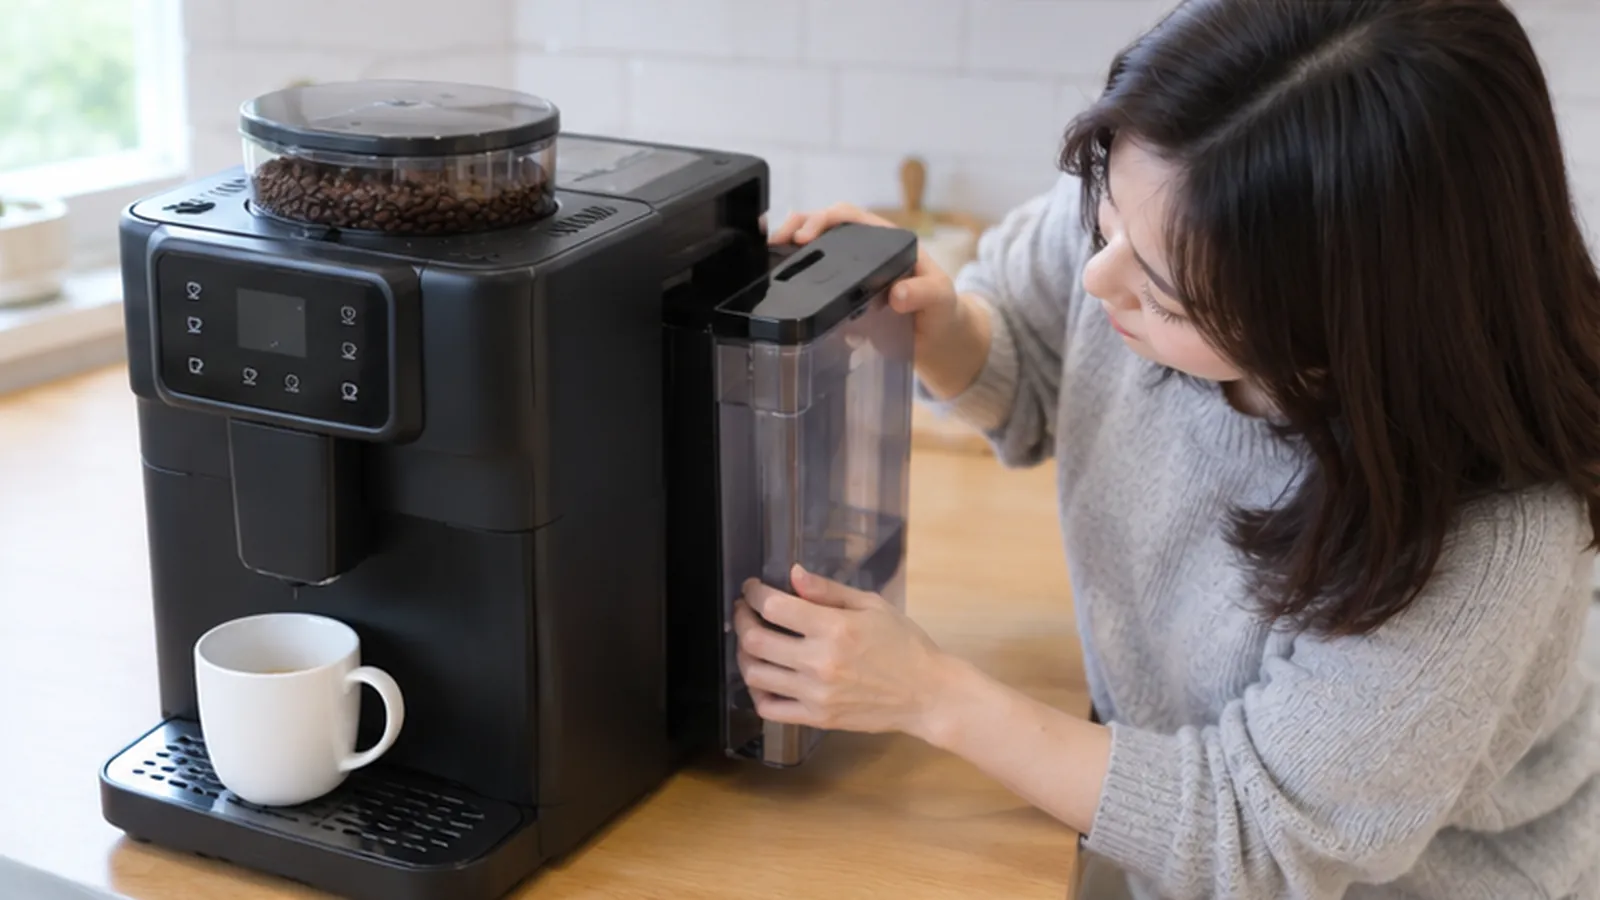
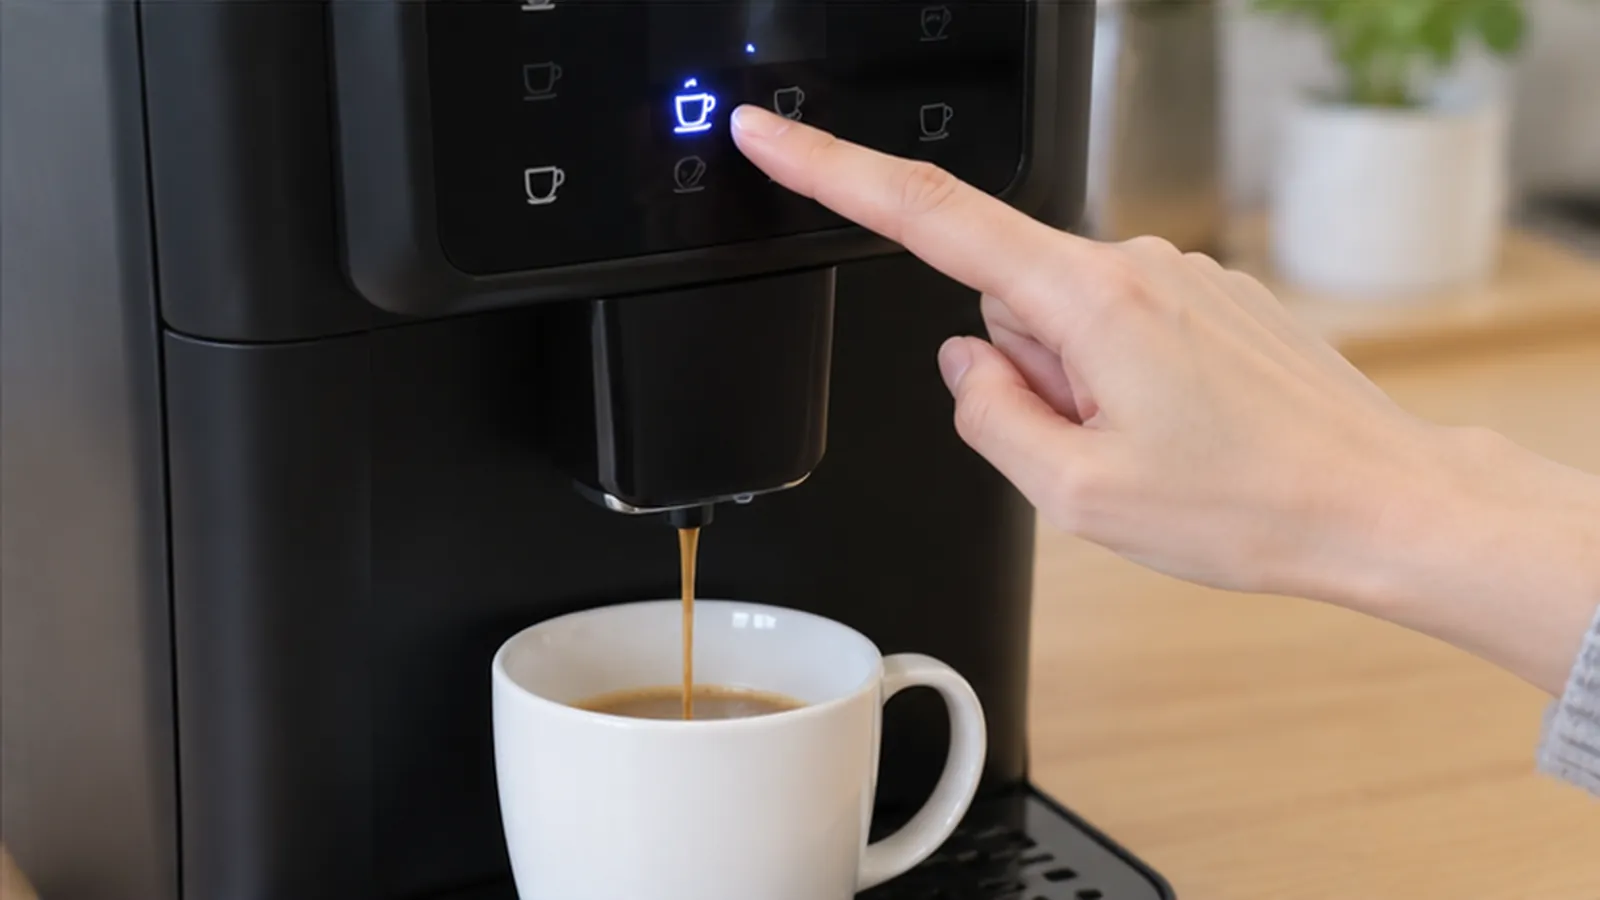
The bean container doesn't come off, so cleaning it is a bit of a hassle.
Auto-generated insight
00:42Top 3 friction scenes
Instagram analysis
Set outreach priorities before you pitch a collaboration.
Questions it answers
Built for
Share of sales by creator type
Sample dataVideo · Beauty specialist
34%of sales
16 creators · $1,240 per video
Video · Beauty mixed
29%of sales
14 creators · $880 per video
Video · Non-beauty
27%of sales
8 creators · $1,610 per video
Live
10%of sales
6 creators · $12 per video
TikTok Shop analysis
Questions it answers
Built for
Brand A · US TikTok Shop · Last 90 days
Sample data90-day revenue
$3.2M
Creators with attributed sales
12,480
Top-10 creators' share
34.7%
Top-selling videos run as ads
88%
Sales concentration (cumulative)
Video vs. live sales
Top creators
Trend reports
Sign up to download the summaries
Create an account and log in to download report summaries as PDFs.
How it works
Get in touch